ASA Bid Point System

Last Updated on


This page describes the All-American Awaaz 2023 Bid Point System. This system was designed by ASA in collaboration with the Bid Point Advisory Council (BPAC) in the summer of 2018, and has been used successfully for the past three competitive seasons. The system comprises of 4 steps:


  1. Tabulation: groups’ performances at each A3 Bid Competition are tabulated and scaled to “absolute” scores out of 100 using the ASA Scoring Rubric
  2. Normalization: scores given by a specific judge at each competition are normalized for that judge
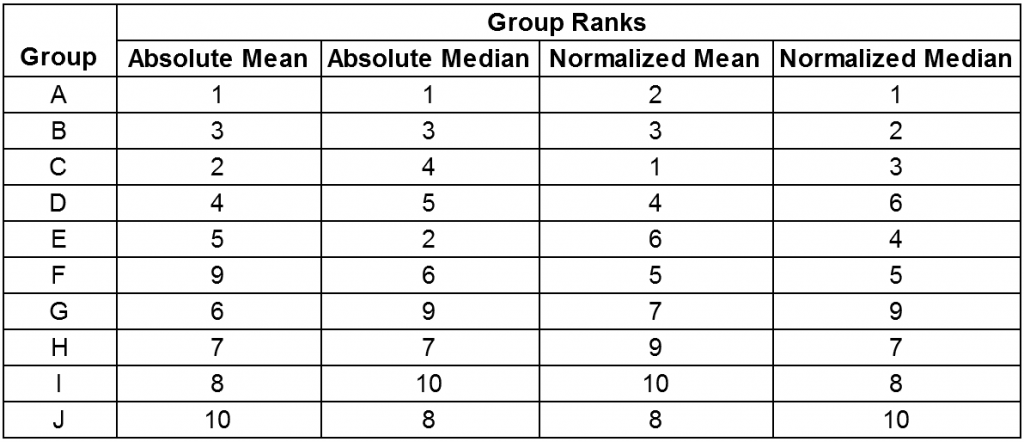
  3. Calculation: absolute and normalized scores from all attended A3 Bid Competitions are compiled and converted into 4 statistical data points (absolute mean, absolute median, relative mean, relative median)
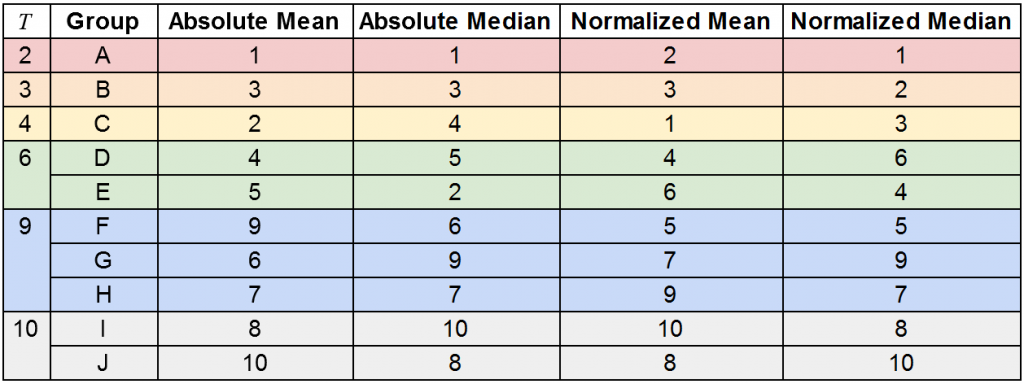
  4. Qualification: at the end of the season, each group is given a rank for each of the 4 statistical data points, and using a threshold system the top 8 groups are chosen for A3


Each of these steps is explained in detail below. We have included a detailed Example at the bottom of this page.

1. Tabulation

In order to create a standardized judging structure, each A3 Bid Competition is required to use the official ASA Scoring Rubric 2023. The categories for 2023 are:


  • Vocal Execution: 30%
  • Visual Execution: 25%
  • Musical Composition: 30%
  • South-Asian Representation: 15%


The judging process is carefully monitored and standardized across all bid competitions. Requirements have been implemented for the judging panel to ensure that it consists of judges from varying backgrounds and encompasses a healthy diversity of musical experience.


Judges will also undergo a standardized pre-competition meeting with an ASA representative to understand the rubric and judging process. This meeting will be used to answer any questions and clarify any doubts that judges (especially those that are new to our circuit) may have.

Click here to view the ASA Scoring Rubric 2023.

2. Normalization

The group scores are normalized by dividing the score received from a particular judge by the average of all scores given by that judge at a  particular competition, and then multiplying by 100. In equation form:


\(\text{Normalized Score}=\frac{\text{Judge’s Score}}{\text{Average of Judge’s Scores}} \times 100\)


This is done for all scores given by all judges across all competitions. Here is an example of the normalization. A sample competition has one judge and three competing groups. Group A scores 50, Group B scores 60, and Group C scores 70. The average score given by the judge is 60. Thus the normalized scores are as follows:

\(\text{Normalized Score}_{\text{(Group A)}} = \frac{50}{60} \times 100 = 83.33\)

\(\text{Normalized Score}_{\text{(Group B)}} = \frac{60}{60} \times 100 = 100.00\)

\(\text{Normalized Score}_{\text{(Group C)}} = \frac{70}{60} \times 100 = 116.66\)


Thus from each competition that a group attends, that group will have 2 data points per judge at the competition (one absolute score and one normalized score).

3. Calculation

The absolute and normalized scores for each group from every attended bid competition are now compiled and four statistical values are calculated:


  1. Let \(a_1,a_2,…,a_k\) be the combined list of absolute scores from all attended bid competitions.
  2. Let \(n_1,n_2,…,n_k\) be the combined list of normalized scores from all attended bid competitions.
  3. A group’s absolute mean and absolute median are computed by calculating the mean and median of \(a_1,a_2,…,a_k\).
  4. A group’s normalized mean and normalized median are computed by calculating the mean and median of \(n_1,n_2,…,n_k\).


The normalized scores aim to eliminate the difference in judges’ perceptions (a score of 60 could mean different things for different judges) and allow the scores at a competition to be more fairly compared. At the same time, also using the absolute scores ensures that we do not ignore when a judge decides to reward a good performance with a high score. The use of the mean (i.e. average) allows us to determine which groups are being scored higher than others. The use of the median allows us to determine whether a group’s range of scores is above, below, or consistent with their average.


At the end of the year, each group now has four values that represent their performance across the attended bid competitions. After the last bid competition, each group is ranked against the other groups in the circuit based on the four statistical values.

At the end of the calculation process, each group now has an absolute mean rank, absolute median rank, normalized mean rank, and normalized median rank. These will be used to determine A3 qualification.

4. Qualification

Once the groups are ranked, we can determine which groups ranked the highest in all 4 categories. This is done using a threshold system. Every team is categorized into a threshold based on the maximum rank among the 4 categories. Here is the process:


  1. We begin with a threshold, represented by \(T\), of 1.
  2. For the current value of \(T\), we select all groups that have all four ranks \(\leq T\).
  3. If, for the chosen value of \(T\), we have less than seven groups, we increase \(T\) by 1 and repeat from step 2.
  4. The minimum value of \(T\) that qualifies at least 8 groups will be called \(T_{final}\).
  5. If there are more than eight groups chosen, the following tiebreaker system is used. Of the groups that are qualified by changing the threshold to \(T_{final}\),
    1. the group with the greater, more positive, value of (\(\text{normalized median}-\text{normalized mean}\)) will be ranked higher
    2. the group with the higher average competition placing will be ranked higher
    3. the group with more categorical awards will be ranked higher

Example

The 4-category ranks of a sample of 10 groups at the end of the competition season are shown below:


We start with a threshold value of \(T=1\). At this point, no groups have all four ranks \(\leq 1\). Thus no groups have been selected for A3. Alas!


The threshold now goes up to \(T=2\). At this point, only group A has all four ranks \( \leq 2\). We do not have at least eight groups, so we continue increasing the threshold.


At \(T=3\), groups A and B have all four ranks \( \leq 3\). We continue to bump up the threshold until we have at least eight groups.


At \(T=9\), we finally have at least eight groups included (groups A through H) that have all ranks \( \leq 9\).


The graded color scale below shows how the increasing threshold reflects the chosen groups that have all four ranks \( \leq T\).


The next step is to break the tie by choosing two groups from F, G, and H so that exactly eight groups are invited to compete at A3.


Assume that the three groups have the following normalized scores:


  • Group F: Normalized Mean 105, Normalized Median 110
  • Group G: Normalized Mean 100, Normalized Median 90
  • Group H: Normalized Mean 95, Normalized Median 105


Thus the tiebreaker values will be:


  • Group F: \(110-105=5\)
  • Group G: \(90 – 100=-10\)
  • Group H: \(105-95=10\)


Thus, groups F and H have the greatest, most positive difference in median and mean, which means that the groups invited to A3 in this sample are groups A-F and H.